
Cannabis Grow Room Air Quality Metrics: The 12 KPIs Every Commercial Cultivator Should Log
Air quality in a grow room is not one number. It is twelve. Temperature, relative humidity, VPD, CO2, PM2.5, PM10, TVOC, ozone, air changes per hour, differential pressure, airborne mold spore CFU per cubic meter, and airborne bacterial CFU per cubic meter. Each has a target range, an instrument that reads it, a sampling cadence, and a reason an auditor cares. This page is the measurement layer: what you log and why. The sibling guides own the fixes. If you came here after a positive mold test on a harvest already worth six figures, the twelve-row table below is where the audit trail starts.
Most air quality content for growers describes problems and then sells a purifier. One top-ranked vendor page states that mold spores "thrive in indoor grow rooms due to the high humidity levels- usually as high as 70 percent." True, and useless at 2 a.m. when an owner asks what your logged RH was in flower room 3. A percentage inside a sentence is not a logged metric. A metric has a target range, a timestamp, and an instrument behind it. That gap is the whole reason this page exists, and it is the gap Steven the Head Grower and the MSO Cultivation Director both have to close before an inspection.
The 12 metrics at a glance
Every metric below is one your crew can read off an instrument and drop into a log. Veg and flower carry different setpoints because the plant wants different things at each stage, so the ranges split by room.
| Metric | Unit | Veg target | Flower target | Instrument | Sampling frequency | Why it matters | --- | --- | --- | --- | --- | --- | --- | Temperature | F | 71-82 | 68-79 | NDIR/thermistor logger | Every 60 sec | Drives VPD and transpiration | Relative humidity | %RH | 55-70 | 40-55 | Capacitive RH sensor | Every 60 sec | Above 60 in flower favors Botrytis | VPD | kPa | 0.8-1.1 | 1.0-1.5 | Derived from temp + RH | Every 60 sec | Governs stomatal water loss | CO2 | ppm | 800-1200 | 1000-1400 | NDIR sensor | Every 60 sec | Caps photosynthetic rate | PM2.5 | ug/m3 | under 12 | under 12 | Optical particle counter | Hourly | Worker exposure, bud contamination | PM10 | ug/m3 | under 50 | under 50 | Optical particle counter | Hourly | Soil dust, trim particulates | TVOC | ppb | see range below | see range below | PID sensor | Hourly | Terpene and solvent load | Ozone | ppb | under 50 | under 50 | Electrochemical cell | Continuous | OSHA worker ceiling | Air changes per hour | ACH | 20-40 | 20-60 | Calculated from CFM/volume | Weekly recalc | Dilution of spores and gases | Differential pressure | Pa | +5 to +15 | neutral to -5 | Magnehelic/digital gauge | Continuous | Prevents room-to-room carryover | Mold spore CFU | CFU/m3 | under 1000 | under 1000 | Impactor or cassette culture | Weekly | Predicts failed state flower test | Bacterial CFU | CFU/m3 | under 1000 | under 1000 | Impactor culture | Weekly | Tracks total yeast and mold load |
The thresholds above are facility operating targets, not regulatory limits. Regulatory limits for flower sit downstream in the state testing section. Treat this table as the SOP header your crew logs against, then read the sections below for the nuance behind each number.
Environmental metrics: the four everyone already knows
Temperature, humidity, VPD, and CO2 are the four most growers already watch, so the discipline here is less about knowing they exist and more about logging them at a cadence that survives an audit.
Temperature runs warmer in veg (roughly 71 to 82 F) and cooler in flower (roughly 68 to 79 F), with a 5 to 10 degree day-to-night drop in late flower to tighten internodes and push color. Log it every 60 seconds, not once a shift, because the spikes between readings are where bud rot pressure builds.
Relative humidity is the metric that most directly predicts a mold problem. Keep veg at 55 to 70 percent and pull flower down to 40 to 55 percent. The RH plus VPD conversation has its own depth, including dehumidifier sizing math, in ourgrow room air quality managementhub. Vapor pressure deficit is the derived metric that tells you what the plant actually feels: 0.8 to 1.1 kPa in veg, 1.0 to 1.5 kPa in flower.
CO2 is the lever that caps photosynthesis once light and water are dialed in. Most commercial flower rooms target 1000 to 1400 ppm during lights-on and let it fall to ambient at lights-off. The exact setpoint and injection control logic is a conversation of its own, and it is the single most asked grow room air question. We keep that depth in the air quality management hub rather than restating it here.
Particulate and chemical metrics: the four most rooms miss
Particulate and chemical load is where logging discipline separates a real SOP from a blog post. These four metrics almost never appear in a grower's daily log, and all four show up in a state or OSHA inspection.
PM2.5 and PM10 are fine and coarse particulate counts. Keep PM2.5 under 12 ug/m3 and PM10 under 50 ug/m3. The sources are mundane: soil dust in veg, trichome and leaf debris in the trim room, foot traffic. An optical particle counter sampled hourly builds the record.
TVOC is total volatile organic compound load, and it is where the ranked competition goes vague. One vendor concedes that "traditional carbon filters can help, they often fall short in completely removing all volatile organic compounds (VOCs)," then stops, offering no number to log against. There is a real number. A peer-reviewed review of cannabis cultivation facilities reported VOC concentrations of 21 to 290 ppb under typical conditions, rising to roughly 1034 ppb when lights and fans were off (Wang et al., Environmental Science and Technology, 2022). Log TVOC hourly with a photoionization detector and treat the lights-off window as your worst case. Carbon filter sizing to hold that load is covered in ourcannabis mold prevention protocolscompanion coverage.
Ozone earns its own row because growers sometimes install ozone-generating "purifiers" without knowing it. With crew in the room, keep ozone under 50 ppb and verify any ionizer carries UL 2998 ozone-free certification. Air changes per hour is the dilution rate that ties these together: 20 to 40 ACH in veg, up to 60 in dense flower canopies. Published ACH guidance exists for homes, offices, and healthcare but almost never for cannabis rooms, so this is a number you calculate from your own CFM and room volume and log weekly.
Airflow and pressure metrics: the two nobody talks about
Air velocity and differential pressure are the two metrics that quietly decide whether a Botrytis outbreak stays in one room. They rarely appear in consumer-facing content at all.
Air velocity across the canopy should sit around 50 to 100 feet per minute, enough to keep boundary-layer moisture off the flower without desiccating it. Stagnant air at the bud is a Botrytis invitation. Differential pressure manages cross-contamination between rooms. Run veg and mother rooms at a slight positive pressure (+5 to +15 Pa) and flower at neutral to slightly negative so spores migrate away from clean stock rather than toward it. A digital or Magnehelic gauge logged continuously is the record a cleanroom auditor expects.
Biological load: the two metrics that decide if the harvest passes
Airborne mold spore CFU and bacterial CFU per cubic meter are the two metrics that most directly predict a failed state test, and they are the two the entire ranked SERP omits.
Sample airborne mold spore CFU weekly with an Andersen impactor or an Air-O-Cell cassette drawn on a calibrated pump, then culture. An in-room operating target under 1000 CFU/m3 gives you headroom before the bioburden on the flower itself climbs. Airborne bacterial CFU, sampled the same way, correlates with the total yeast and mold count the state lab runs on your flower pre-sale.
The thresholds that actually gate your sale live in state rule, and they differ. Colorado, Michigan, California, Nevada, and Massachusetts each set their own total yeast and mold limits on flower, which is why an SOP tuned for one state footprint does not transfer cleanly to the next. When a room trends toward the ceiling, the fix is prevention protocol and between-cycle disinfection, covered next and in ourcannabis mold prevention protocolscoverage.
Building the audit trail: the MSO angle
A metric nobody logged is a metric that does not exist when an auditor asks. The audit trail is where the twelve numbers become a defensible record, and it is the layer a Cultivation Director running 4 to 15 facilities cares about most.
Continuous monitoring platforms (Aranet, Trolmaster, Growlink, Argus) log temperature, RH, VPD, CO2, and often particulate and pressure on fixed intervals and export to CSV. The biological CFU readings come off a lab report and get keyed in weekly. What a state inspector asks for is narrow and predictable: timestamped readings, the instrument of record, the sampling SOP, and retention, typically two to three years. Standardizing that export schema across every facility is the difference between one defensible dashboard and fifteen incompatible spreadsheets. For a multi-site metrics rollout, a GroClarity specialist can map a single logging schema across your footprint through thecultivation IPM expertiseprogram.
Between-cycle disinfection: the metric that resets your baseline
The twelve metrics tell you where the room sits. Between-cycle disinfection is how you reset the biological baseline before the next crop inherits last cycle's spore load. This is a product-adjacent step, so the claim language here is exact.
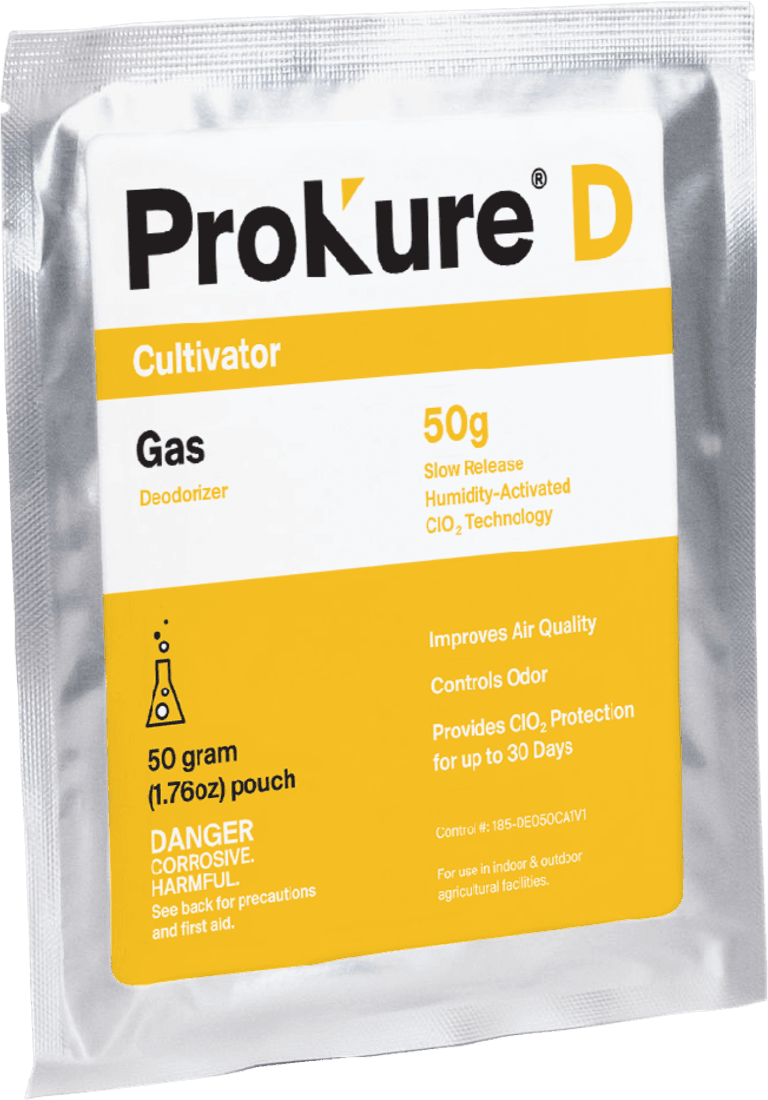
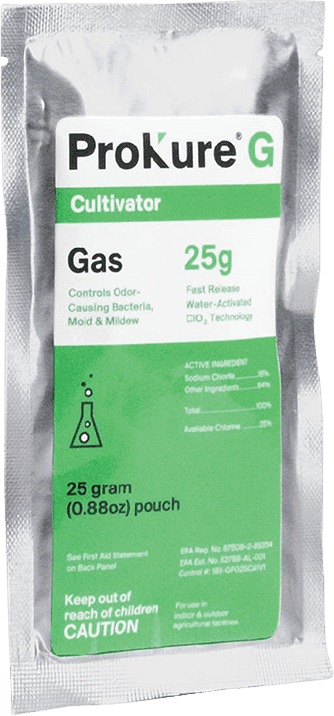
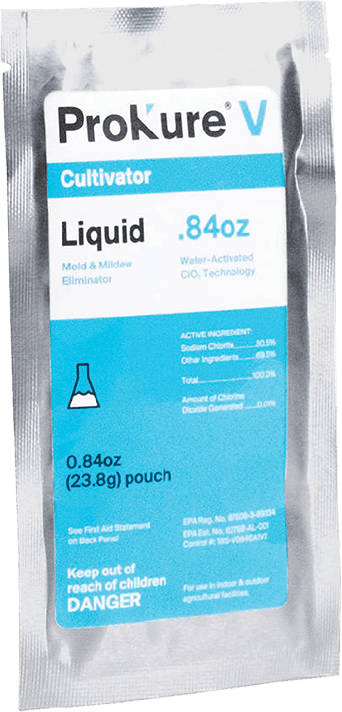
Surface disinfection between cycles is where airborne and settled bioburden gets knocked down before it can seed the new crop. ProKure V is a liquid Hospital-Type Disinfectant, EPA Reg. No. 87508-3-89334, applied to hard non-porous surfaces at an exposure time of 10 minutes at 100 ppm. Its label kill list for hard surfaces includes Aspergillus niger (ATCC 9642), Fusarium solani (ATCC 36031), Botrytis sp., and methicillin-resistant S. aureus (ATCC 33591). It is suitable for use with plants in the room and leaves no residue, which is the combination bleach and quaternary disinfectants cannot claim and the reason it fits a between-cycle surface turnover when a full tear-down is not possible. For the air half of the reset, ProKure G is a fast-release gas Deodorizing Delivery System, EPA Reg. No. 87508-2-89334, that works in 4 to 6 hours in an empty room and carries the label instruction "Not for use with/on plants/crops/feed." ProKure D provides ClO2 protection for up to 30 days for ongoing air quality and odor control; it is not an EPA-registered product and not labeled for sale as a pesticide under 40 CFR. Reorder on shop.groclarity.com; full labels, SDS, and registration detail live on prokuresolutions.com.
Where to go next
You now have the twelve metrics, their ranges, their instruments, and the log an auditor will read. The sibling guides carry the fix for each one, and the product line resets the baseline between cycles.
Start with thegrow room air quality managementhub for the fixes behind each number, read thecannabis mold prevention protocolscoverage when a biological metric trends out of range, and talk to a GroClarity specialist through thecultivation IPM expertiseprogram for a multi-site logging rollout.