
The Real ROI of Mold Prevention in Cannabis Cultivation: What a Failed Harvest Actually Costs You
You are not asking how to prevent mold. Your grower already knows the humidity targets and the airflow rules. You are asking a different question: does the money you spend preventing mold come back, and by how much. That is a P&L question, and almost nobody on the first page of search results answers it in dollars. The honest answer is that a single failed Aspergillus test on a mature crop costs more than a year of a prevention protocol, usually by a wide margin. This page lays out the math, exposes its assumptions, and names the EPA scope that governs which products you can actually put in a grow room. Built on Science. Backed by Results.
The question owners actually ask
The trade press and the vendor blogs treat mold as a technique problem. One of the top-ranking commercial guides says its goal is to arm cannabis growmasters and industry executives with the knowledge needed to make informed mold management decisions, ultimately guiding them toward the most efficient, safe, and quality-preserving methods available. That is method guidance aimed at an executive, and it never once puts a dollar figure on the decision. An owner, a GM, or a CFO does not need another explainer on relative humidity. You need the ratio: prevention spend per year against the loss you are preventing. Everything below is that ratio.
What a failed harvest actually costs
Direct crop loss
Start with the number that hurts. A mature flower crop carries real wholesale value, and the cultivation intake for operators in this category describes a crop already worth six figures before a positive test lands. When a batch fails a state pre-sale yeast and mold screen, that value is at risk in a single lab result. The crop did the hard part. It grew. The loss is not a slow bleed; it is a cliff on test day.
Remediation when a batch can be salvaged
Some failed batches can be remediated rather than destroyed. Post-harvest options exist, and they are not free. Ozone treatment, X-ray decontamination, and iHP misting are all sold as remediation services or capital systems, each priced per pound or per machine. Every one of them is a cost you would not pay if the batch had not failed, and each one risks some effect on the product you are trying to sell. Remediation is the better outcome than destruction, and it is still a loss against a crop that should have passed clean.
Re-test cost and delay
Remediation means a re-test, and a re-test means delay. The lab fee is the small part. The expensive part is the batch sitting in limbo while its market window moves and your cash stays locked in inventory you cannot sell yet.
A destroyed batch
When remediation is not an option, the batch is destroyed, often under state disposal and chain-of-custody requirements that cost staff time to document. That is the full-loss scenario: the crop value, the labor to grow it, and the paperwork to prove you threw it away.
The downtime tax between cycles
Turnover days and crew evacuation
There is a second cost that never shows up as a line item: the days a room sits idle during a turnover. A bleach or quat room turn can force a crew evacuation and several days of downtime while fumes clear and surfaces are re-cleaned. Facility managers in this category routinely lose three to five days per turn to that routine, per the cultivation intake pain points.
Converting days into annualized revenue
Days are cycles. Operators in this category reorder sanitation supplies roughly 13.6 times a year, per the ProKure purchase-mix intake, which tells you how often rooms turn. Every turnover day you cannot run is a fraction of a harvest cycle you did not grow. A residue-free program that lets you re-enter faster is not a convenience; it buys back growing days, and growing days are revenue. That is the reorder cadence the ProKure V liquid disinfectant workflow is built around.
What a prevention protocol actually costs per year
The annual spend, grounded in real order data
Here is the figure the vendor blogs never publish: what prevention actually costs per year. The cultivation intake reports an average sanitation order of about $2,466 and roughly 13.6 reorders per year for an operator in this category. That is the real, grounded annual spend band for a working ClO2-based program, drawn from purchase data rather than invented for a sales page. Hold that number next to a six-figure crop and the ratio answers itself.
Labor, consumables, and storage
The annual product spend is not the whole cost. Add the labor hours per turnover, the consumables, and the storage and SDS management for a regulated product. These are modest against the crop value, and naming them keeps the math honest rather than rosy.
The ROI math, worked example
Every figure here is illustrative, with the assumption set exposed, because the honest version of ROI math shows its work.
Single-room grow
Take the intake spend band: about $2,466 per order at roughly 13.6 orders a year. For a single-room operator that is the annual prevention cost. Set it against one modeled failed harvest of a six-figure crop. The prevention program is a small single-digit percentage of the loss it is insuring against. You do not need a spreadsheet to see which side wins.
Multi-room established operation
Scale to a head grower running several flower rooms. The prevention spend scales with room count; the downside scales with how many mature crops are exposed at test time. More rooms means more crop value at risk on any given test day, which widens the ratio in prevention's favor, not against it. The mold prevention protocols framework is where that program gets standardized across rooms.
Multi-state operator across three states
For a multi-state operator, add a procurement line the single-room grower never sees. Different states approve different sanitizers, which fragments purchasing, multiplies SDS management, and scatters price leverage. Consolidating onto one ClO2 product line across every state is itself an ROI item: fewer vendors, one documentation set, standardized protocols your compliance team can defend. The multi-state cannabis operator guidance covers that consolidation.
The compliance line that changes the math
EPA registration and what it means for a cultivation sanitizer
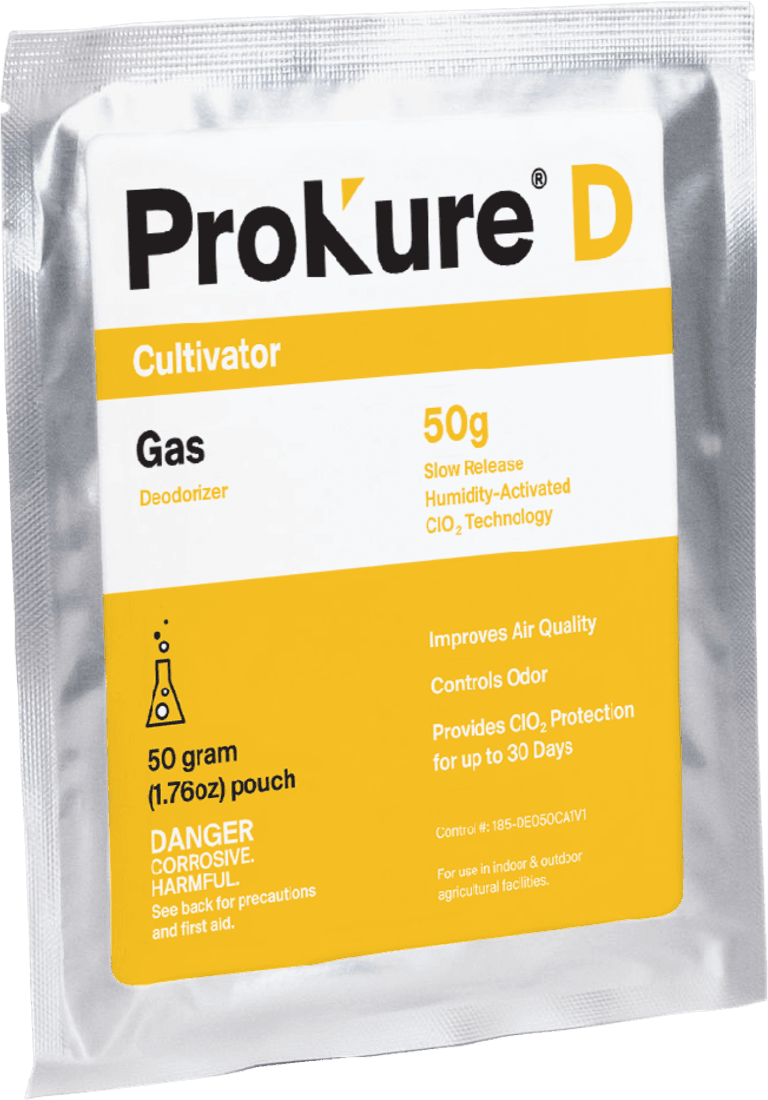
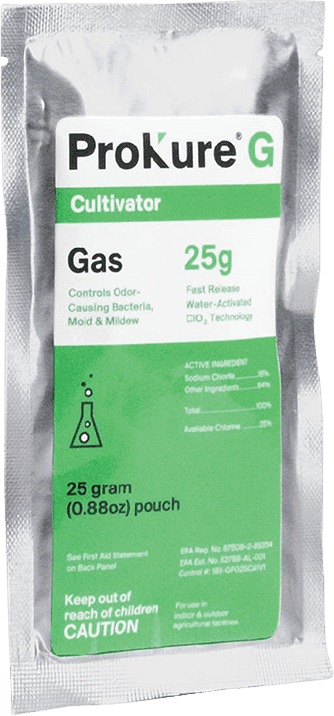
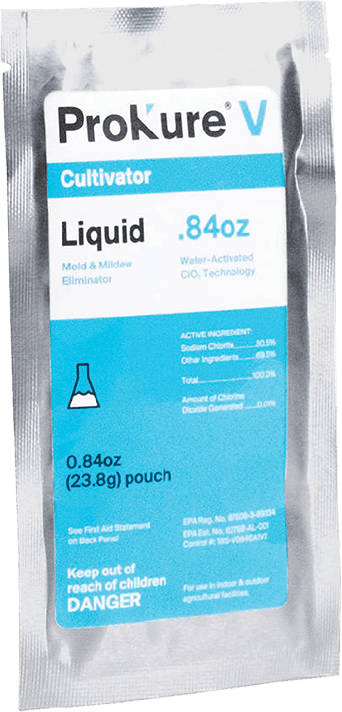
EPA scope is where a lot of ROI math quietly breaks, so it goes in the copy, not a footnote. Not every product you can buy is cleared for the use you have in mind. In the ProKure line, ProKure V is a liquid surface disinfectant, EPA Reg. No. 87508-3-89334, and it is suitable for use with plants in the room because it is applied to surfaces, not the crop. ProKure G is a fast-release gas deodorizer, EPA Reg. No. 87508-2-89334, for empty rooms only. ProKure D is a slow-release gas that improves air quality and controls odors, and it is not an EPA-registered product and is not labeled for sale as a pesticide under 40 CFR. Those are three different scopes, and mixing them up is how a program fails an audit.
The plants/crops/feed disclaimer
ProKure G carries the verbatim restriction "Not for use with/on plants/crops/feed," which is why it runs in empty rooms between cycles and comes out before plants go back in. Knowing which product carries which restriction is the difference between a protocol that passes review and one that does not.
State thresholds move the probability
State pre-sale microbial thresholds vary, and a lower threshold means a higher probability of failing a test, which means a bigger payback on prevention. The ratio is not fixed; it gets more favorable the stricter your state is.
Documentation at audit time
Keep the SDS and the product label in the compliance file, and log each product as what it is: V and G with their registration numbers, D as an air-quality measure. The documentation is cheap. The audit finding you avoid is not.
License and insurance risk not on the P&L
Repeat failures and license review
There is risk that never appears on the income statement. A pattern of failed batches can draw state license review, and a license is the whole business, not a line item. Prevention is cheap insurance against the one outcome a cannabis operator cannot buy back.
Crop-loss insurance
Preventable contamination can also affect how a crop-loss insurer treats a claim and prices a premium. An owner is measured on both the P&L and the license, and prevention protects the side of the ledger that does not show up in a monthly report until it is too late.
What ClO2 is, in one paragraph
Chlorine dioxide (ClO2) is a selective oxidizer, not chlorine and not bleach. It works at low concentrations and, in the ProKure line, comes in three forms: a liquid surface disinfectant (V), a fast-release gas for empty rooms (G), and a slow-release gas that holds air quality for up to 30 days with plants in the room (D). That is the short version. If your team wants the full safety and chemistry picture before pricing a program, the air quality management overview carries the depth, and your path to price a program starts with the mold prevention protocols framework and a quote.
Related resources