
Cannabis IPM Statistics and Contamination Rates: The Numbers That Actually Govern a Harvest
You came looking for a contamination rate. A clean industry number you could use to benchmark your facility or settle an argument. Here is the honest answer: the single most useful cannabis IPM statistic is not an industry average at all. It is your own pre-sale yeast and mold load, measured against your own state's threshold, on this harvest. State thresholds and allowed-substance lists vary by state, testing methods differ, and a blended national rate mixes numbers that do not belong together. The data that governs whether your crop sells is in-house and measurable: air-test readings, turnover days, reorder cadence, and whether the protocol holds. Track those, and the industry averages stop mattering.
Why a single industry contamination rate is the wrong number to chase
Growers ask for the national contamination rate because it feels like it should exist, the way a batting average or a crime rate exists. The problem is that the inputs are not uniform enough to average honestly. A pre-sale test in one state is run against a different yeast and mold load threshold than the same test in another state. The testing method can differ. What counts as a failure, and how failures get reported, is not standardized across markets. Blend all of that into one percentage and you have produced a number that is precise and meaningless.
GroClarity's whole posture is the science of biosecurity, and the science part means a number is only worth citing if you can trace it, verify it, and defend it. A national contamination rate fails all three tests. So rather than invent one, this page does the more useful thing: it tells you which statistics are real, which vary too much to plan on, and which ones you should be measuring inside your own facility this cycle. That is the data-backed habit a Head Grower needs, not a borrowed figure that may not describe a single room in your building.
There is a second reason the chase for an industry rate leads growers astray. It encourages planning against someone else's facility instead of your own. Your contamination risk is a function of your genetics, your room design, your HVAC, your crew's SOPs, and your local climate. None of those are captured in a national average. Two facilities in the same state can run wildly different mold loads because one has a humidity problem the other solved two years ago. The average tells you nothing actionable about either.
It is worth being blunt about the incentive, too. Plenty of marketing copy quotes a scary industry contamination percentage because fear sells prevention. GroClarity's position, written into its voice principles, is the opposite: lead with the data a grower can actually verify, not the number that reads most alarming. A statistic you cannot source is not evidence. It is a prop. A prop might move a sale, but it does not help you pass a test, and it will not survive an auditor asking where the number came from.
So the frame for the rest of this page is a swap. Trade the question what is the industry contamination rate for the question which numbers in my own operation predict a pass or a fail, and how do I move them. That is a question with real answers, and the answers are the statistics worth publishing. The rest of this page groups them: the numbers that decide the harvest, the numbers that run operations, the numbers that run the business, the one knowledge statistic that drives churn, and how all of it changes across a multi-state footprint.
If you want the one-line version to take into your next vendor or ownership conversation, it is this: a statistic you cannot act on is trivia, and a statistic you cannot verify is a liability. The industry contamination rate fails both tests. Every number below passes both, because every one of them is measured inside your own facility, on your own equipment, against your own state's rules. That is the difference between data that runs a program and data that just fills a slide. The grower who internalizes that difference stops asking for the industry number and starts building the dashboard that actually protects the harvest.
The numbers that decide the harvest
Two statistics sit closest to the thing you actually care about, whether the crop sells. One is the gate itself. The other is the leading indicator that tells you, early, whether you are going to clear it.
Your pre-sale yeast and mold load against your state threshold
Every commercial cannabis harvest in a regulated market runs into one gate before it can be sold: a pre-sale test, and in most programs that test includes a total yeast and mold count. Pass the threshold, the crop sells. Fail it, and a harvest that may already be worth six figures is in jeopardy. That single number, your measured yeast and mold load against your state's threshold, is the statistic that governs the economics of the grow.
The threshold itself is a state variable, not a national constant. Your state program sets the number, and it is not the same number your neighbor two states over has to clear. This is exactly why a national contamination rate is unhelpful: there is no national line to be above or below. The only line that matters to your harvest is your state's line, pulled from your state's current regulations, not from a summary article. Treat the exact threshold as a figure you look up per market and keep current, because programs revise them.
A note on how to read the test result itself: a yeast and mold count is a count, not a yes-or-no, and the threshold is the cutoff drawn on that count. Two harvests can both pass while sitting at very different places on the scale, and the one closer to the line is carrying more risk into the next cycle even though both got the same pass stamp. Reading the raw count, not just the pass flag, is what lets you see trouble early. A grower who logs the actual number every harvest builds a trend line, and a trend line is the thing that warns you a month before a failure instead of the day of one.
The reason cost is rarely the blocker for prevention is that the math on this one statistic is lopsided. A failed test on a mature crop can wipe out the value of the whole harvest. The operators GroClarity works with treat prevention as justified by crop value, because the downside of the number going the wrong way is catastrophic and the cost of keeping it right is routine. When a Head Grower says cost is not the issue, this is the statistic they are reacting to. They have either failed a test or watched a peer fail one, and they have priced the difference.
What you can do about this number is the whole point of an IPM program. You cannot change your state's threshold. You can change your measured load, by controlling the air and the surfaces the crop and the crew contact. The cultivation IPM expertise GroClarity brings is the practice of building a protocol specifically around keeping that one number under the line, harvest after harvest, with a data trail that proves it. Everything else in this section exists to tell you whether that protocol is working before the pre-sale test does.
One more thing about this statistic deserves saying plainly, because it is where growers get caught. A pass is not a trend. Passing one harvest tells you that one harvest cleared the line. It does not tell you the room is clean, the protocol is sound, or the next crop is safe. A room that passed at the bottom edge of the threshold is a room that is one humidity spike from failing. So the useful version of this number is not pass or fail, it is the margin: how far under the threshold did you land. A comfortable margin is a healthy protocol. A margin that shrinks cycle over cycle is a warning you get to act on before a failure, if you are tracking the margin rather than just the binary result.
Air-test readings, the leading indicator you control
A pre-sale yeast and mold load is a lagging indicator. By the time you have it, the crop is grown and the die is mostly cast. The statistic that lets you intervene earlier is the air-test reading, the airborne mold and microbial load in the room, measured before and after a treatment and tracked over time.
Air-test data is valuable precisely because it is yours and it is verifiable. You take a reading, you treat the room, you take another reading, and the delta is evidence. A grower at Good Day Farm reported the field version of that evidence in a published testimonial, saying mold levels went down 98 percent after the first cleaning. That is the kind of number that means something, because it is a measured before-and-after in a specific facility, not a borrowed average. It is also the kind of number an auditor respects, because it is a record you can produce on demand.
For a Head Grower whose job includes proving air quality to compliance auditors, this is the statistic that builds the data trail. A single reading is a snapshot. A series of readings across cycles is a trend, and a trend is what proves a protocol holds. The air-quality management pillar covers how to set up that before-and-after measurement so the numbers accumulate into something defensible rather than sitting as disconnected one-offs.
There is a discipline to it. Measure the same way each time, at the same points in the room, at the same stage of the cycle, so the numbers are comparable. An air-test program that changes its method every cycle produces data you cannot trend, which is the same problem as a national average: precision without comparability. Consistency is what turns readings into statistics. The payoff is that you stop guessing whether the protocol is working and start knowing, cycle over cycle, with a number you can show. And because the reading comes before the pre-sale test, it is the number that gives you time to act, to re-treat, adjust coverage, or chase down a humidity source, while there is still something you can do.
Air-test data also changes the character of the conversation with ownership and with auditors. Without it, a Head Grower defending the IPM program is making an argument from reputation: trust me, the rooms are clean. With a trended series of before-and-after readings, the grower is making an argument from evidence: here is the load before treatment, here is the load after, here is the trend across the last six cycles. One of those arguments survives a skeptical auditor and one does not. The customer journey GroClarity sees for cultivators ends in ongoing air testing and detailed reports precisely because that evidence is what reassures both ownership and regulators that the protocol is doing what it claims. The reading is not just a control input. It is the proof artifact, and proof is the thing a compliance-minded operator is actually buying.
The numbers that run operations
The next pair of statistics is not about whether the crop passes. It is about how efficiently you get there. These are the numbers a Facility Manager feels in their calendar.
Turnover days per room per cycle
Ask a Facility Manager for their most painful number and it will not be a contamination rate. It will be room turnover time, the days a room sits out of production between harvests while it gets cleaned, treated, and reset. For a single-room or small multi-room grow, that window can run 3 to 5 days per cycle, and every day a room is down is a day it is not growing revenue.
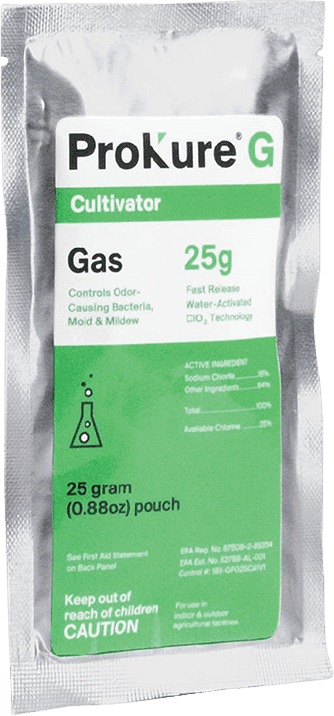
Turnover days are a statistic worth measuring because they respond directly to the sanitation method you pick, which means you can move them. A full bleach-fog protocol is not a one-step job. It is fog, then a surface wipe-down to deal with the salt residue, then an HVAC purge, often stretched across those 3 to 5 days. A whole-room ClO2 gas treatment runs on a different clock: ProKure G calls for at least 4 to 6 hours for the system to work plus one hour of ventilation before re-entry, per its label. An overnight treatment and a one-hour vent is a different number than a multi-day fog-and-wipe cycle.
The reason residue shows up here is that it is the hidden driver of the turnover statistic. The step that stretches turnover from hours into days is usually the rinse or wipe a residue-leaving product forces. A product described by its vendor as working without generating hazardous residues, like ProKure G, skips that step. So the turnover-days number and the residue question are the same question viewed from two angles: what a product leaves behind is what decides how many days it costs you.
Track turnover days per room per cycle and you get a statistic that connects directly to output. More harvests per year is the Facility Manager's version of winning, and the arithmetic is simple: shorter turnover means more cycles. If a facility runs several rooms, the gain compounds, because the time saved per room multiplies across the whole floor and across every cycle in the year. The mold-prevention protocols pillar walks through where a ClO2 step replaces a fog step in the turnover sequence, and what that does to the days-down number.
Put a conservative version of the arithmetic on paper and the point lands. Suppose a room runs on a cycle measured in weeks and the turnover between cycles is the only slack in the calendar. Shaving two or three days off each turnover does not just save those days once. It saves them every cycle, and over a year of back-to-back cycles the saved days can add up to a meaningful fraction of an extra cycle's worth of production capacity per room. Multiply by the number of rooms and the turnover statistic stops looking like a housekeeping metric and starts looking like a capacity lever. That is why a Facility Manager who gets measured on harvests per year should treat turnover days as a headline number, not a footnote, and why the sanitation method, which is the biggest single input to that number, is a production decision as much as a cleaning one.
Coverage math, the arithmetic that sizes a treatment
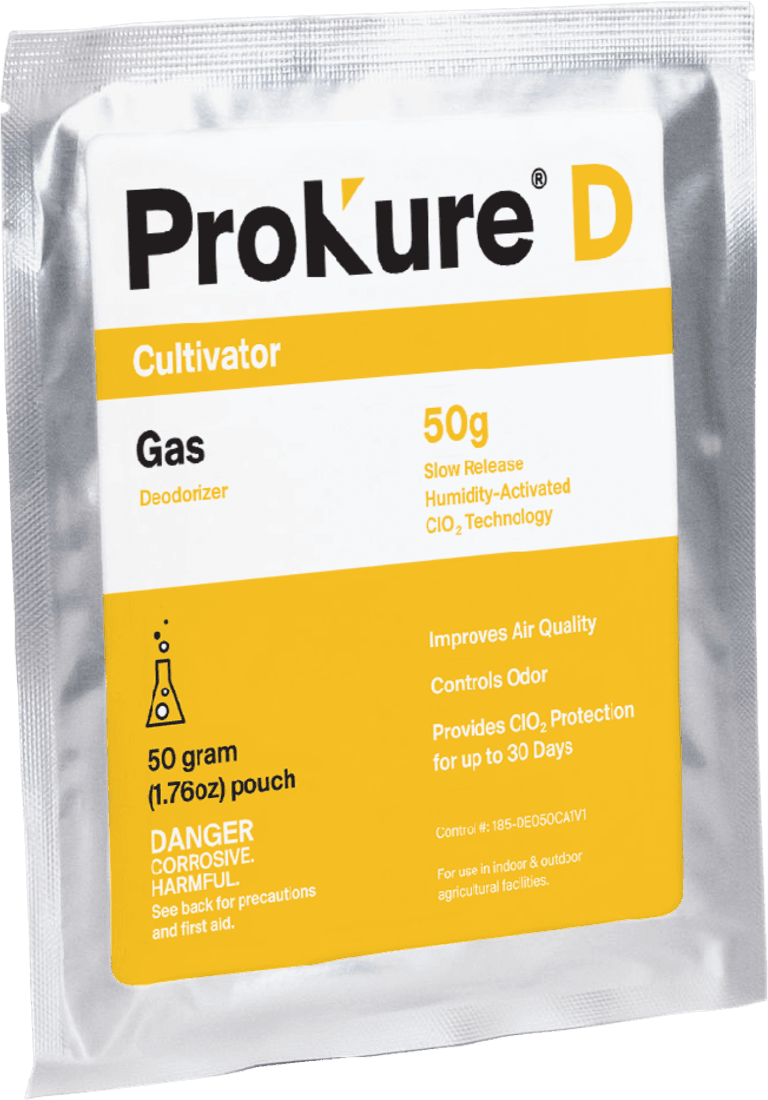
Some IPM statistics are not about risk at all. They are about arithmetic, and getting the arithmetic right is what makes the risk statistics behave. Coverage numbers are the clearest example. ProKure G coverage is published on the label: a 10-gram pouch treats roughly 1,000 cubic feet, and a 25-gram pouch treats roughly 2,250 cubic feet. ProKure D, the slow-release gas, scales by pouch size for the volume it protects and provides ClO2 protection for up to 30 days per pouch placement.
These numbers matter because the most common protocol error is not using the wrong product, it is using the right product at the wrong dose for the room. Under-dose a room relative to its cubic footage and the treatment underperforms, which can show up later as a bad air-test reading or, worse, a pre-sale load that drifts toward the threshold. Over-dose and you are not buying more safety, you are raising the gas concentration with its own handling considerations, since ClO2 is a strong oxidizer with real precautionary language on the label. The coverage statistic is the instruction that keeps both failure modes off the table.
Calculating the number is straightforward and worth doing every time. Measure the room in cubic feet, match the pouch size and count to the published coverage, and place pouches for even distribution in larger spaces. That one calculation turns a guess into a dosed treatment, and a dosed treatment is what makes your air-test and pre-sale numbers predictable rather than lucky. The ProKure G fast-release gas pillar carries the coverage math and the activation steps so the sizing calculation is something your crew can run without improvising.
The up-to qualifier on the D protection window is itself a statistic to read carefully. The product provides ClO2 protection for up to 30 days, which is a maximum, not a guarantee of a flat 30-day plateau. Treat it as a replacement cadence: replace each pouch before its up-to-30-day window closes to maintain the level. Reading up to 30 days as exactly 30 days is the kind of small misreading that leaves a gap in your air-quality coverage, and a gap is where a contamination number creeps the wrong way.
The two gas products split the coverage conversation along the phase of the cycle, and keeping the split clear is part of getting the arithmetic right. ProKure G is the fast reset, sized for a whole room between harvests and working in a 4 to 6 hour window. ProKure D is the continuous layer, sized for the volume it protects and holding for up to the 30-day maximum while the room is in use. One is a burst, one is a sustain. Sizing them is not interchangeable, and neither is their job. A grower who tries to cover a continuous-protection need with a single fast-reset treatment, or who hangs a slow-release product expecting an overnight knockdown, has made a coverage-statistics error that no amount of product will fix, because the number they needed was the match between the product's release profile and the phase of the cycle, not the raw pouch count. The air-quality management pillar lays out which release profile belongs in which phase so the coverage math is applied to the right product in the first place.
The numbers that run the business
An owner does not experience IPM as a chemistry problem. They experience it as a line on the P&L. Two statistics make that line legible, and GroClarity has real figures for both.
Reorder cadence and average spend
The purchase data the company works from shows cannabis operators reordering roughly 13.6 times a year at an average order near $2,466. Those two figures reframe the whole budgeting conversation.
The first thing the cadence tells you is that IPM sanitation is an operating expense, not a capital purchase. Reordering roughly 13.6 times a year means this is a recurring line, close to monthly, and recurring lines are where small per-cycle inefficiencies compound. A product that adds a rinse step, forces extra labor, or has to be reapplied because it does not hold costs you that tax on every one of those reorders. Across a year, the cheapest unit price can be the most expensive protocol. The owner who models the annual number instead of the shelf price is the one who prices this correctly.
The second thing the numbers do is give the prevention-pays argument a real shape. Set the recurring cost, roughly 13.6 orders a year near $2,466 each, against the occasional catastrophic cost, a failed pre-sale test erasing a six-figure crop. That is not a close call, and it is not a vague appeal to peace of mind. It is a budgetable, predictable line protecting against a large, occasional loss. GroClarity publishes these operating numbers rather than hiding behind soft language precisely because a Business Director deserves to run the P&L math, not just hear that prevention is worth it.
The cadence number also quietly disciplines the vendor relationship. A line that recurs close to monthly is one where fulfillment reliability matters as much as unit price. An owner whose supplier is slow or inconsistent on a 13.6-times-a-year reorder is an owner who will eventually find a room waiting on product it should already have. So the reorder statistic is not only a budgeting input. It is the reason procurement should care about lead times, account-level ordering, and documentation sitting in one place, because a recurring line with a flaky supply chain is a contamination risk wearing a logistics costume. The reliable-reorder path is part of the protocol, not a convenience bolted on after.
Purchase mix, where the volume actually goes
The purchase-mix statistics sit underneath the cadence and tell the owner where the spend lands. In the data, ProKure D runs 50.2 percent of volume, ProKure G 40.1 percent, and ProKure V 9.15 percent, with the remainder negligible. That mix is a fact about how real operators buy, not a recommendation pulled from the air.
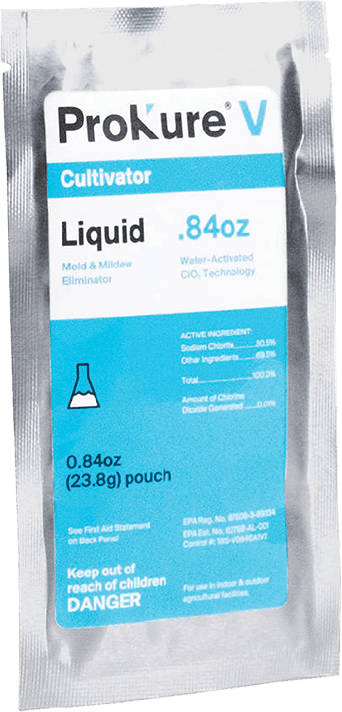
Read it and two things fall out. First, the air-management products, D and G, drive about 90 percent of orders combined, which tells an owner the continuous-air and fast-reset layers are the backbone of the recurring spend. Second, the surface disinfectant V is the smaller share at 9.15 percent, but it is not optional: it is the between-cycle surface-turnover piece that the gas products do not do, the hospital-type disinfectant you can use with plants in the room. An owner who stocks and budgets to the real mix, weighted toward D and G without dropping V, is budgeting to how the protocol is actually run rather than to an even split that matches no one's usage.
The mix is also a quiet check on a vendor. If someone tries to sell you a protocol that is mostly surface disinfectant, the real purchase data says that is not how working facilities buy. The volume is in the air layer. A protocol weighted the other way is either solving a different problem or selling you the wrong thing.
It is worth sitting with why the air layer dominates, because it reframes how a grower should think about contamination in the first place. Surface disinfection handles the benches, trays, and tools between crops, which matters, but mold in a grow room is fundamentally an airborne and environmental problem. Spores move through the air and settle where conditions let them grow. That is why the continuous and fast-reset air products carry roughly 90 percent of the spend: the operators buying at scale have learned that controlling the environment around the plants is where the contamination fight is actually won, which is exactly the upstream, treat-the-environment-not-the-plant approach the product line was built around. The purchase mix is not just a budgeting fact. It is the collective judgment of working facilities about where the risk lives, expressed in dollars. An owner who reads it that way is getting a free lesson from the rest of the market.
The knowledge statistic that drives churn
Not every important IPM statistic is about the crop. One of the most telling numbers GroClarity tracks is about the growers themselves: why operators stop ordering. On that churn list, the fourth most common reason is plain ignorance of what ClO2 actually is. People buy the product, misunderstand the chemistry or the label, use it like a product they already know, get a result they did not expect, and walk away.
That statistic is why a page like this one exists. The churn is not driven by the product failing. It is driven by a good product used under a false mental model: treating ClO2 like bleach, misreading a label restriction, skipping the coverage math, or mistaking an up-to window for a fixed one. Each of those is a misunderstanding, and each is fixable with the right information before the product is used, not after the grower has already concluded the category does not work.
The practical lesson for a grower reading this is that the most dangerous IPM statistic in your operation might be the knowledge gap on your own crew. A perfectly chosen protocol underperforms when the person running it holds a myth about how it works. A crew that mis-doses because nobody ran the coverage math, or re-enters too early because nobody read the ventilation window, will produce worse air-test and pre-sale numbers than the product is capable of, and the product will get the blame.
This is where GroClarity's cultivation IPM expertise earns its place: the expertise is the part that closes the gap, matching the right product to the right phase and making sure the crew runs it to the label. Getting the chemistry right and the human running it right are the same job, and the churn number is the proof that skipping the second half costs you.
The fix for the knowledge statistic is cheaper than any of the others on this page, which is what makes it the most frustrating one to leave unaddressed. A written SOP that the crew follows, a short explanation of what ClO2 is and is not, and a coverage calculation posted where the treatment happens will move the number more than a product swap would. Nothing on that list requires a bigger budget. It requires someone treating the crew's understanding as a measurable input to the program, the way they already treat air-test readings and turnover days. The operators who churn on reason four are rarely the ones who were under-resourced. They are the ones who assumed the product would carry the knowledge, and it does not. The knowledge has to be installed on purpose.
How multi-state operators should think about contamination statistics
For a Cultivation Director at a multi-state operator, the statistics problem multiplies. There is no single threshold to clear, because each state program sets its own yeast and mold load threshold and maintains its own allowed-substance list of inputs a licensed cultivator may use. A number that passes in one market may not even be the right number to measure against in another. This is the clearest case against a national average: a director who planned to a blended rate would be planning to a line that exists in no state they operate in.
The move that works is standardize-then-verify, and it separates two things that a national-average mindset conflates. An EPA registration is federal and does not change across state lines: ProKure G carries EPA Reg. No. 87508-2-89334 and ProKure V carries EPA Reg. No. 87508-3-89334 in every market. The allowed-substance question is state-level and has to be checked market by market. So a director can standardize on one EPA-registered protocol as the baseline, then verify it against each state's allowed-substance list, rather than sourcing a different vendor in every market and tracking incompatible numbers everywhere.
The statistic that makes this manageable is not a contamination rate at all. It is the count of sanitation vendors and documentation sets a director has to maintain. Standardizing on one protocol collapses that count to one SDS, one label PDF, and one registration number per product, checked against local rules, instead of a different documentation set per market. When an audit hits in one state, the paperwork is already identical to every other state, so there is no scramble to find records that live with a different vendor somewhere else.
The multi-state cannabis operator industry page lays out that standardize-then-verify approach for a footprint that spans several programs, and why the documentation burden, not the chemistry, is usually what makes multi-state IPM feel harder than it is. The chemistry performs the same in every room. It is the paperwork that varies, and standardizing is how you stop the paperwork from setting the pace.
There is a data advantage to standardizing that a director should not overlook. When every facility runs the same protocol and measures the same way, the numbers become comparable across the whole footprint. A director can look at air-test trends, turnover days, and pre-sale margins side by side across markets and actually see which facility is drifting, because the measurements mean the same thing everywhere. Run a different vendor and a different method in each state and you lose that: every facility's numbers are an island, and you cannot tell a real problem from a measurement difference. Standardization is not only a procurement and compliance win. It is what makes the statistics across a multi-state footprint legible as a single dataset instead of a pile of incompatible local reports. For a director whose job is to spot the facility heading for trouble before it fails a test, comparable numbers are the entire game.
What to measure, and what to ignore
Strip the industry-average mirage away and the statistics that run a cannabis IPM program are a short, concrete list, and all of them are yours to measure. Your pre-sale yeast and mold load against your state's threshold, per harvest, is the statistic that decides whether the crop sells. Your air-test readings before and after treatment, trended across cycles with a consistent method, are the leading indicator that tells you the protocol is working before the pre-sale test confirms it. Your turnover days per room per cycle are the operations number that converts sanitation choices into harvests per year. Your reorder cadence and spend, against the roughly 13.6 orders a year near $2,466 benchmark, are the P&L statistics that let an owner model the annual cost honestly. And your coverage math, sized to each room's cubic footage against the published pouch coverage, is the arithmetic that makes all the other numbers behave.
The number to ignore is the borrowed one. A national contamination rate blends incompatible state thresholds, testing methods, and reporting rules into a figure that describes no actual facility, least of all yours. It cannot be verified, cannot be traced to a source you would defend to an auditor, and cannot tell you anything you can act on. The science of biosecurity is the habit of refusing numbers like that and measuring the ones you can stand behind.
Build your program around the handful of statistics you control, and the question you arrived with, what is the industry contamination rate, stops being a question you need answered. You will have your own numbers, measured your own way, trended across your own cycles, and defensible to anyone who asks. Those are the only statistics your harvest responds to, and they are the ones worth your attention.
Related resources
Related resources